Field Data & Analytics Service

We turn raw field data
into decisions you can trust.

AMOEBA supports marketing research teams end-to-end — from CAPI/CAWI fieldwork and questionnaire scripting, through tabulation and statistics, to reporting your stakeholders actually understand.

How we work

Five pillars, one workflow

Every project moves through the same disciplined path — from data preparation to insight your team can act on.

01

Software & Tools

High quality in data preparation

CAPI & CAWI — Survey To Go, KoBoToolbox & LimeSurvey. Choosing the right CAPI application for fast‑turnaround projects keeps costs under control, and disciplined scripting gets us to zero‑error data.

Tabulation — QPS, CL & Macro Tab, Python.

Statistical analysis — SPSS, XLSTAT, R, Python, AMOS, LISREL & PLS.
02

Online Report

Deep analysis & impactful insight

Built on Tableau and Power BI, our reporting starts with structured, systematic questionnaires designed around modern statistical principles — the foundation for analysis that's genuinely comprehensive, not just presentable.

03

Team Support

Quality control, done properly

Audio-visual QC to verify fieldwork as it happens, and dedicated coders for open-end responses, so nothing gets lost between the field and the dataset.

04

Machine Learning & Data Visualization

Reports you can reach anywhere

Accessible offline and online, with live field-progress monitoring — so you can watch your project move in real time and report on it the moment it matters.

05

Our People

Responsive & responsible advisory

Two decades of hands-on research experience behind every project — a team that trains as hard as it delivers. Meet them below.

Our people

The team behind the numbers

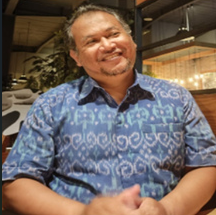
Portrait of Chaerudin

Chaerudin

Data Preparation & Statistical Analysis, Quality Control

21+ years in the marketing research industry. Builds systematic, efficient QC processes, trains smart and resilient data-preparation teams, and coaches research teams in advanced statistical analysis. Formerly with MARS, DEKA & CLOVE.

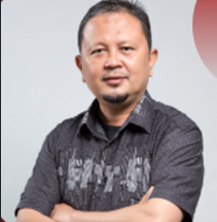
Portrait of Fahmi Darmawan

Fahmi Darmawan

Machine Learning & Data Visualization

24+ years in the marketing research industry, specializing in data processing and tooling, with process automation through VBA and Python. Applies machine learning for faster, smarter decision-making. Formerly with MARS, Nielsen & DEKA.

Pricing

Price list

Indicative rates across data preparation, reporting, statistical analysis and advisory support. All figures are in IDR, thousands (Rp x1,000), and vary with project scope and complexity.

Job levelLOI (minutes)ScriptingTabulationTools
EasyLess than 20750750QPS, Survey To Go, KoBoToolbox, LimeSurvey
Medium21–451,000–2,0001,500–2,500QPS, Survey To Go, KoBoToolbox, LimeSurvey
AdvanceMore than 452,000–3,0002,500–4,000QPS, Survey To Go, KoBoToolbox, LimeSurvey

Coding open-end: Rp 250 per open-end response.

NoMaterialToolsIDR (x1,000)Note
1Dashboard achievement projectTableau / Power BI1,000–5,000Depends on number of panels
2Dashboard of topline reportTableau / Power BI3,000–10,000Depends on number of slides
3ChartingPowerPoint10,000 / slideNo template
4ChartingPowerPoint20,000 / slideWith template
MaterialToolsIDR (x1,000)Note
1. Perceptual mapping
Map correspondenceXLSTAT500–2,000Max 10 breaks
Positioning & brand imageExcel250–1,000Max 10 breaks
BiplotMacro Biplot500–750Max 10 breaks
Multiple correspondenceXLSTAT1,000–3,000Max 10 breaks
2. Statistical test
Proportion testMacro500All headers
Mean score testMacro500All headers
Non-parametric testMacrofrom 300Per break header
3. Factor analysis
Factor analysisSPSS, R500–1,000By total
4. ANOVA (Analysis of Variance)
ANOVASPSS, Rfrom 1,000By total & treatment
5. Driver analysis
Correlation analysisSPSS / Excel200–500Max 10 breaks
Partial correlation (impact analysis)R500–1,000Max 10 breaks
Linear regression (driver analysis)SPSS, R500–2,000Max 10 breaks
Path analysisPLS1,000–3,000Max 10 breaks
Non-linear regressionSPSS, R2,000–3,000Max 10 breaks
6. Segmentation analysis (12,000–25,000)
ClusterSPSS, XLSTAT, R1,000–3,000Number of attributes
DiscriminantSPSS, XLSTAT, R3,000–5,000Number of attributes
CHAIDSPSS, XLSTAT, R2,000–3,000Number of attributes
Discriminant with covariance analysisLatent Gold5,000–8,000Number of attributes
7. Penalty analysis
Penalty analysisXLSTAT1,000By total
8. Ideal range analysis
Ideal range analysisSPSS, Macro1,000–3,000Max 6 products
9. Acceptable price analysis (PSM)
Acceptable price analysisExcel500–1,500Max 10 breaks
10. TURF analysis
TURF analysisXLSTAT1,500By total
11. Conjoint analysis
Simple conjointXLSTAT3,000–5,000Number of combinations
CBCXLSTAT4,000–6,000Number of combinations
MaxDiffXLSTAT3,000–4,000Number of combinations
12. Weighting data
Weighting dataSPSS, QPS500–1,000Depth of weighting matrix
13. Questionnaire validity & reliability test
Validity & reliability testSPSS500–1,000Number of questions & sections
14. Quadrant analysis
Key driver, gap & consumer value analysisXLSTAT, SPSS2,500–4,000By total
15. Structural Equation Modeling (SEM)
SEMLISREL, AMOS5,000–10,000By total
16. Brand equity model
Brand equity modelQPS + Excel, SPSS5,000–7,500By total
17. Predictive analysis
Predictive analysisSPSS, XLSTAT, R7,500–15,000By total
18. Text mining
Sentiment analysis (social media, web news, etc.)Python, R10,000–20,000By time period
19. Media monitoring analysis
Media monitoring analysisPython, R15,000–30,000By time period
20. Machine learning & data visualization
ML & data visualizationJava, R, VB, web dev10,000–25,000Per project
NoType of advisorJob descriptionIDR (x1,000) / month
1Data Processing advisorInput, tips and problem-solving tricks for issues that arise in data preparation, scripting, data cleaning and tabulation.3,000–5,000
2Data Analysis advisorEverything in Data Processing advisor, plus advising PM/researchers on questionnaire design with full analysis features, and support for in-depth analysis of every insight to explore.6,000–8,000
3QC advisorOptimize CAPI software as a QC tool, manually and systematically.2,000–3,000

Note: all prices listed depend on the number of projects per month.

Want a tailored quote for your project? Reach our team directly.